The Texas Gerrymander
A Data Driven Analysis

Earlier this year President Trump asked Texas Republicans to find him five more Republican Congressmen. This post is not about the morality of that ask or the way that Texas has implemented it. It’s not about the Supreme Court’s involvement or the gerrymandering arms race. It’s about understanding Texas’ congressional map and its new gerrymander with cold, hard data.
And if that gives you the ability to ruin your MAGA relatives’ Christmas…. well… that’s just a happy coincidence.
Texas in 2024
Let’s start with something familiar. Here’s what the Texas congressional map looked like in 2024.
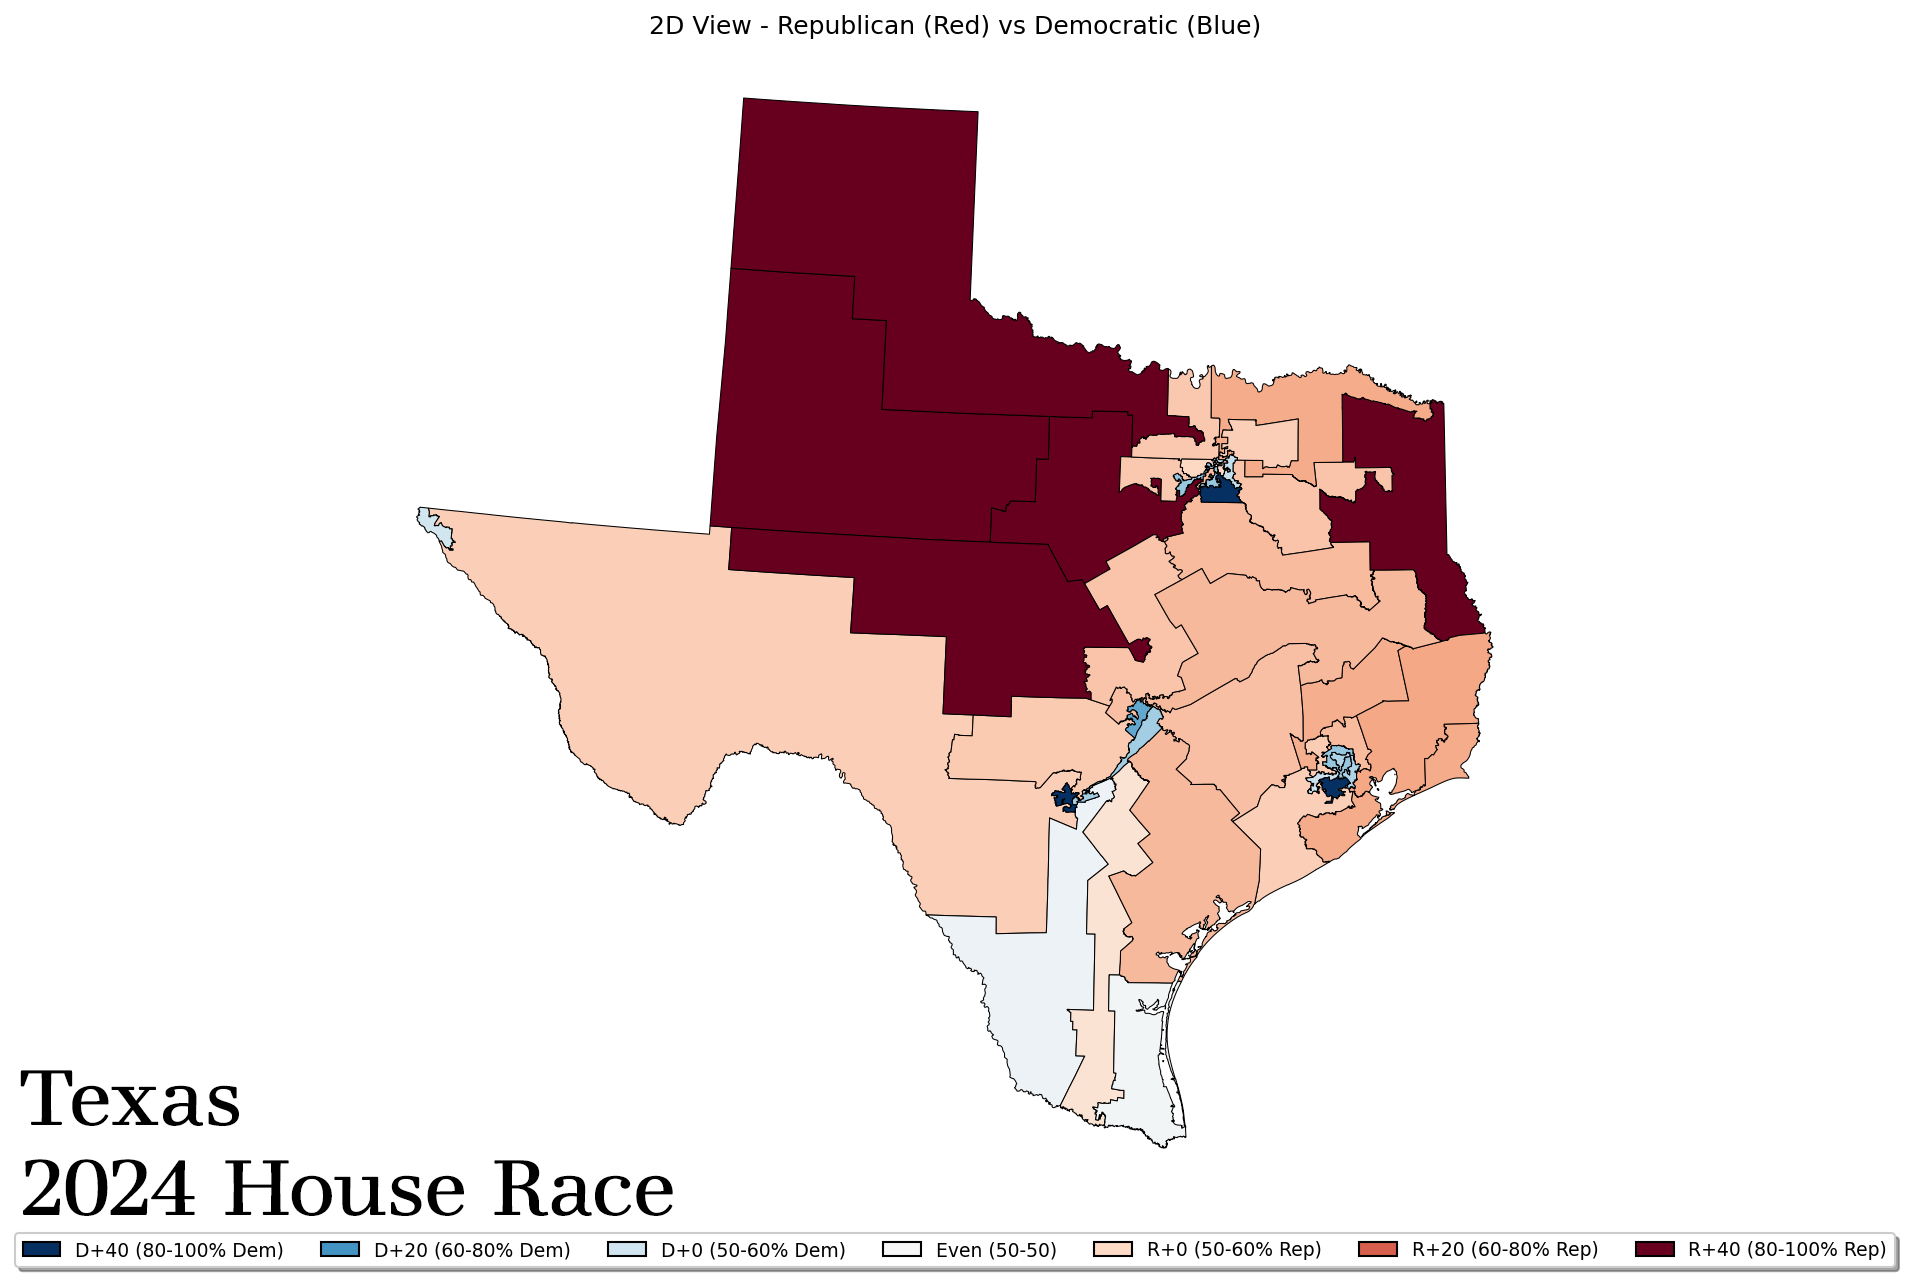
Of the 10 million or so votes cast in the Texas Congressional election, about 6 million of them were Republican to about 4 million Democratic ones. And, while the above map looks pretty red, Texas ended up pretty close to a 60/40 split House delegation with Republicans taking home a few more seats due to the existing Texas gerrymander.
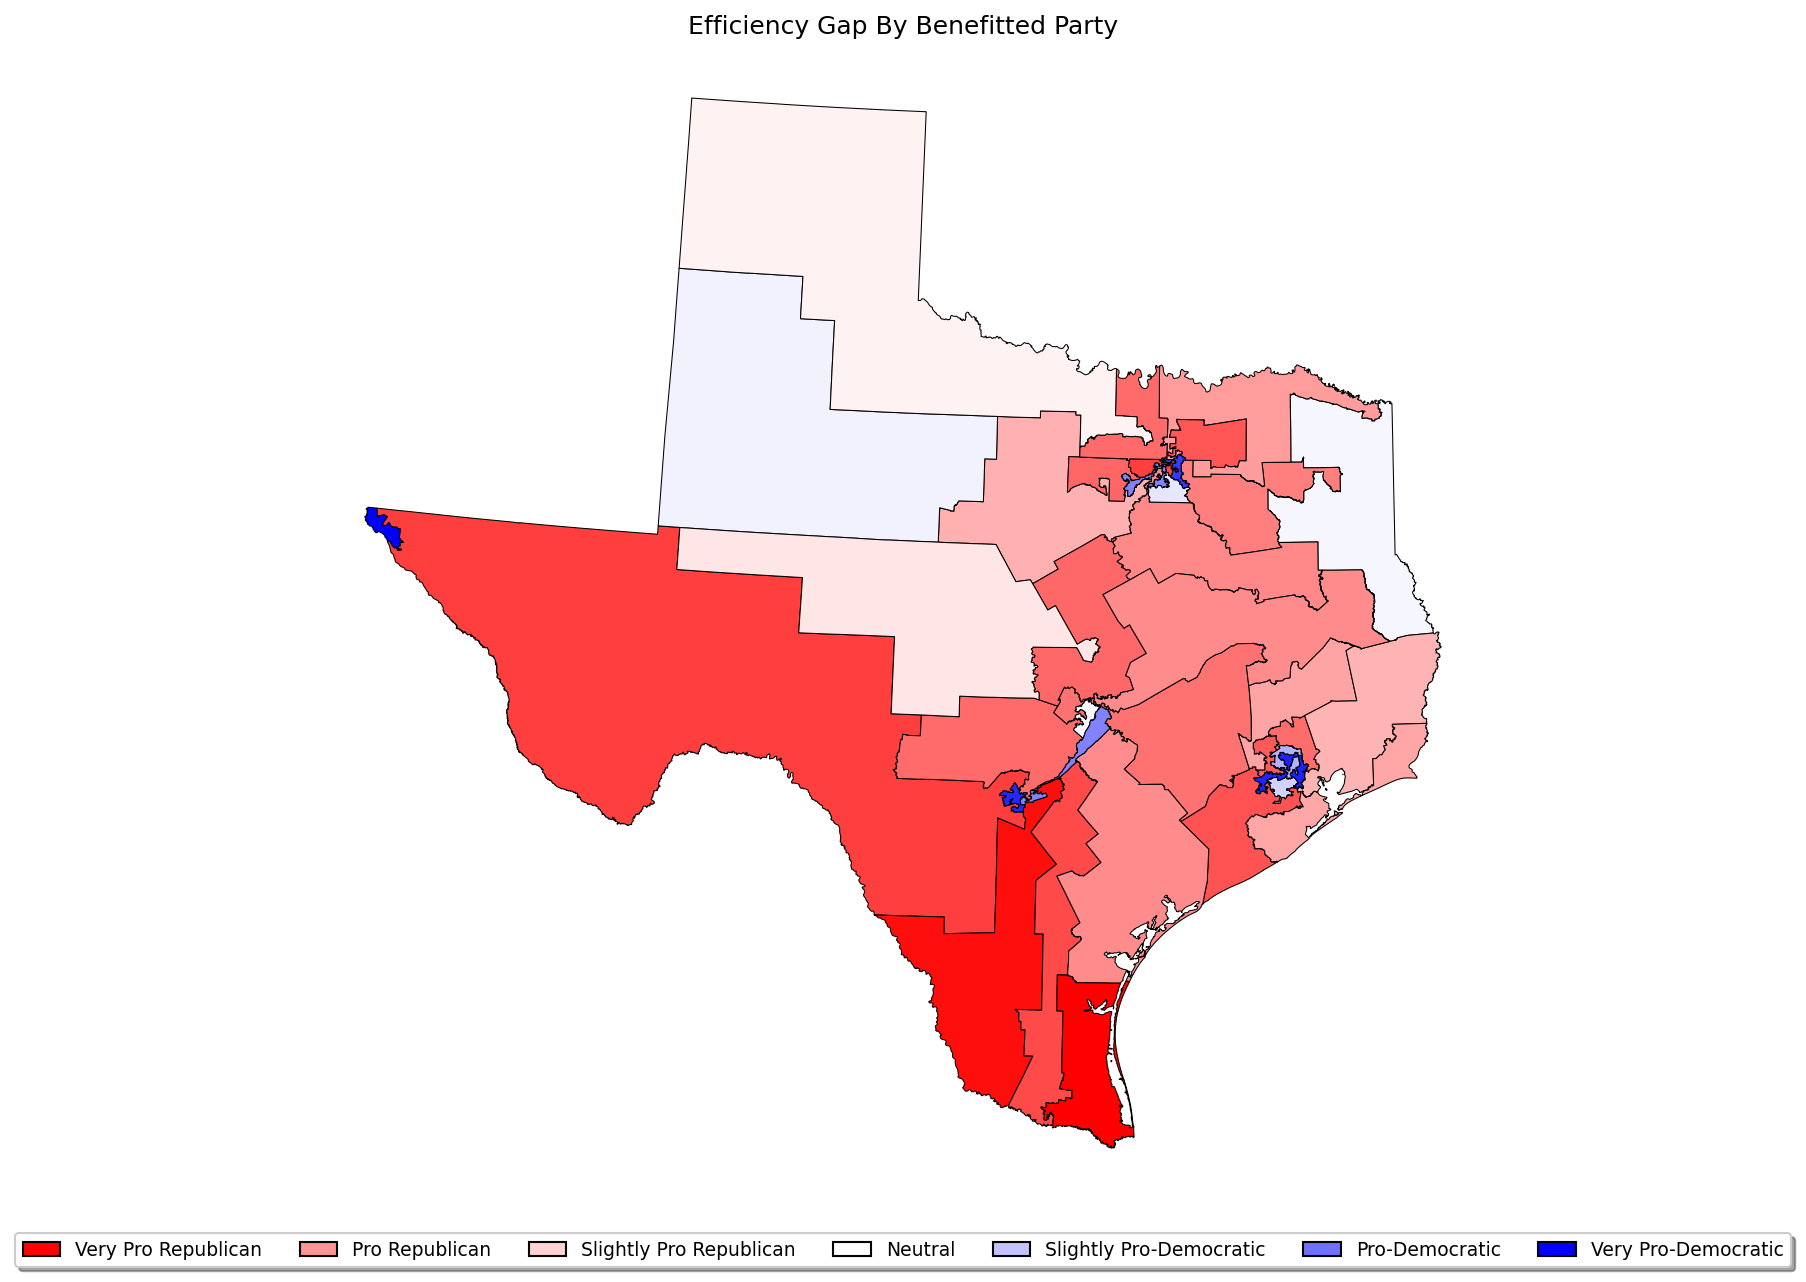
And yes, Texas had an existing Republican gerrymander in 2024. We can say that definitively because we can use “wasted votes” to measure the gerrymander by generating an efficiency gap.
Wasted Votes and Efficiency Gaps
Let’s start with “wasted votes.” A wasted vote is any vote that doesn’t elect a candidate. So, every vote for the losing candidate is a wasted vote. Every vote for the winning candidate beyond the 50%+1 needed to elect them is also wasted. We’ll come back to “wasted votes” later but an effective gerrymander wastes one party’s votes more than the other.
That difference in waste is called the “Efficiency Gap.”
Mathematically this means that efficiency gaps that benefit Democrats are positive while efficiency gaps that benefit Republicans are negative. That’s cumbersome though, so usually we just talk about the absolute value of the gap and say who it benefits.
An efficiency gap of 8% or less in favor of either party is usually considered “fair.” In Texas, in 2024 the efficiency gap favored Republicans by 5.27%.
Except, not really.
The Problem of Safe Seats
Gerrymandered maps create “safe” seats and, in those safe seats, candidates often run unopposed. Eight Texas representatives ran unopposed (by a major party candidate) in 2024.
Those unopposed runs skew our calculation. If a candidate runs an unopposed race, fully half of the votes for that candidate are wasted and we have no idea how many votes a losing opposition candidate would have attracted and wasted. Without that information, it’s very hard to judge the fairness of the overall map. Unfortunately, we can’t just go back and re-play the 2024 election with a fully-funded, strong opposition candidate in each of those elections.
But we can fake it.
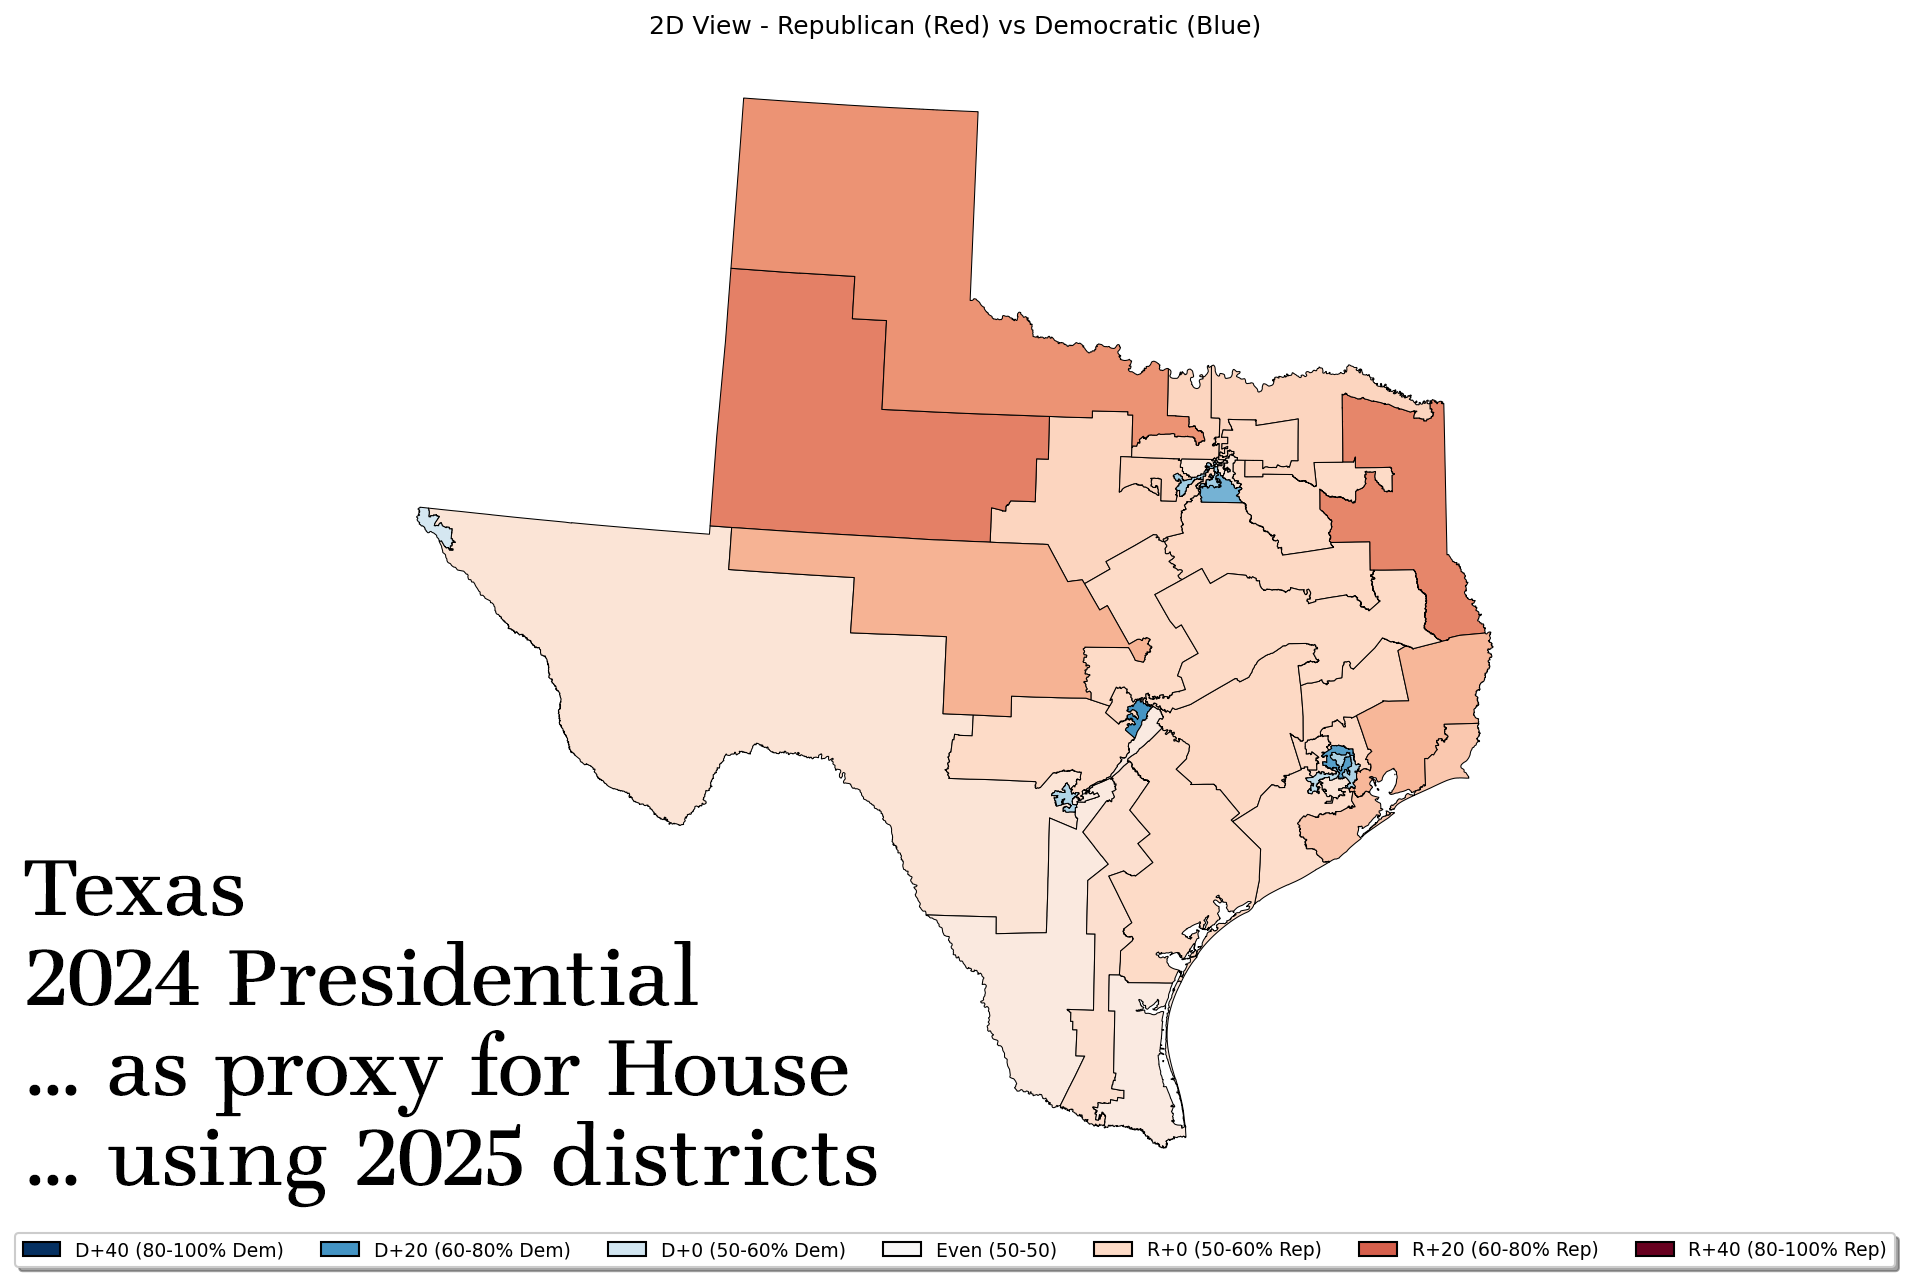
Presidential Proxy
The 2024 election was a Presidential election and, while Texas isn’t a swing state, it was absolutely in play. Harris and Trump both ran meaningful campaigns in the state and voter turnout was high. Though Republican congressional candidates out-performed Trump by about 2%, we can use the Presidential race as a reasonable proxy for the House races.
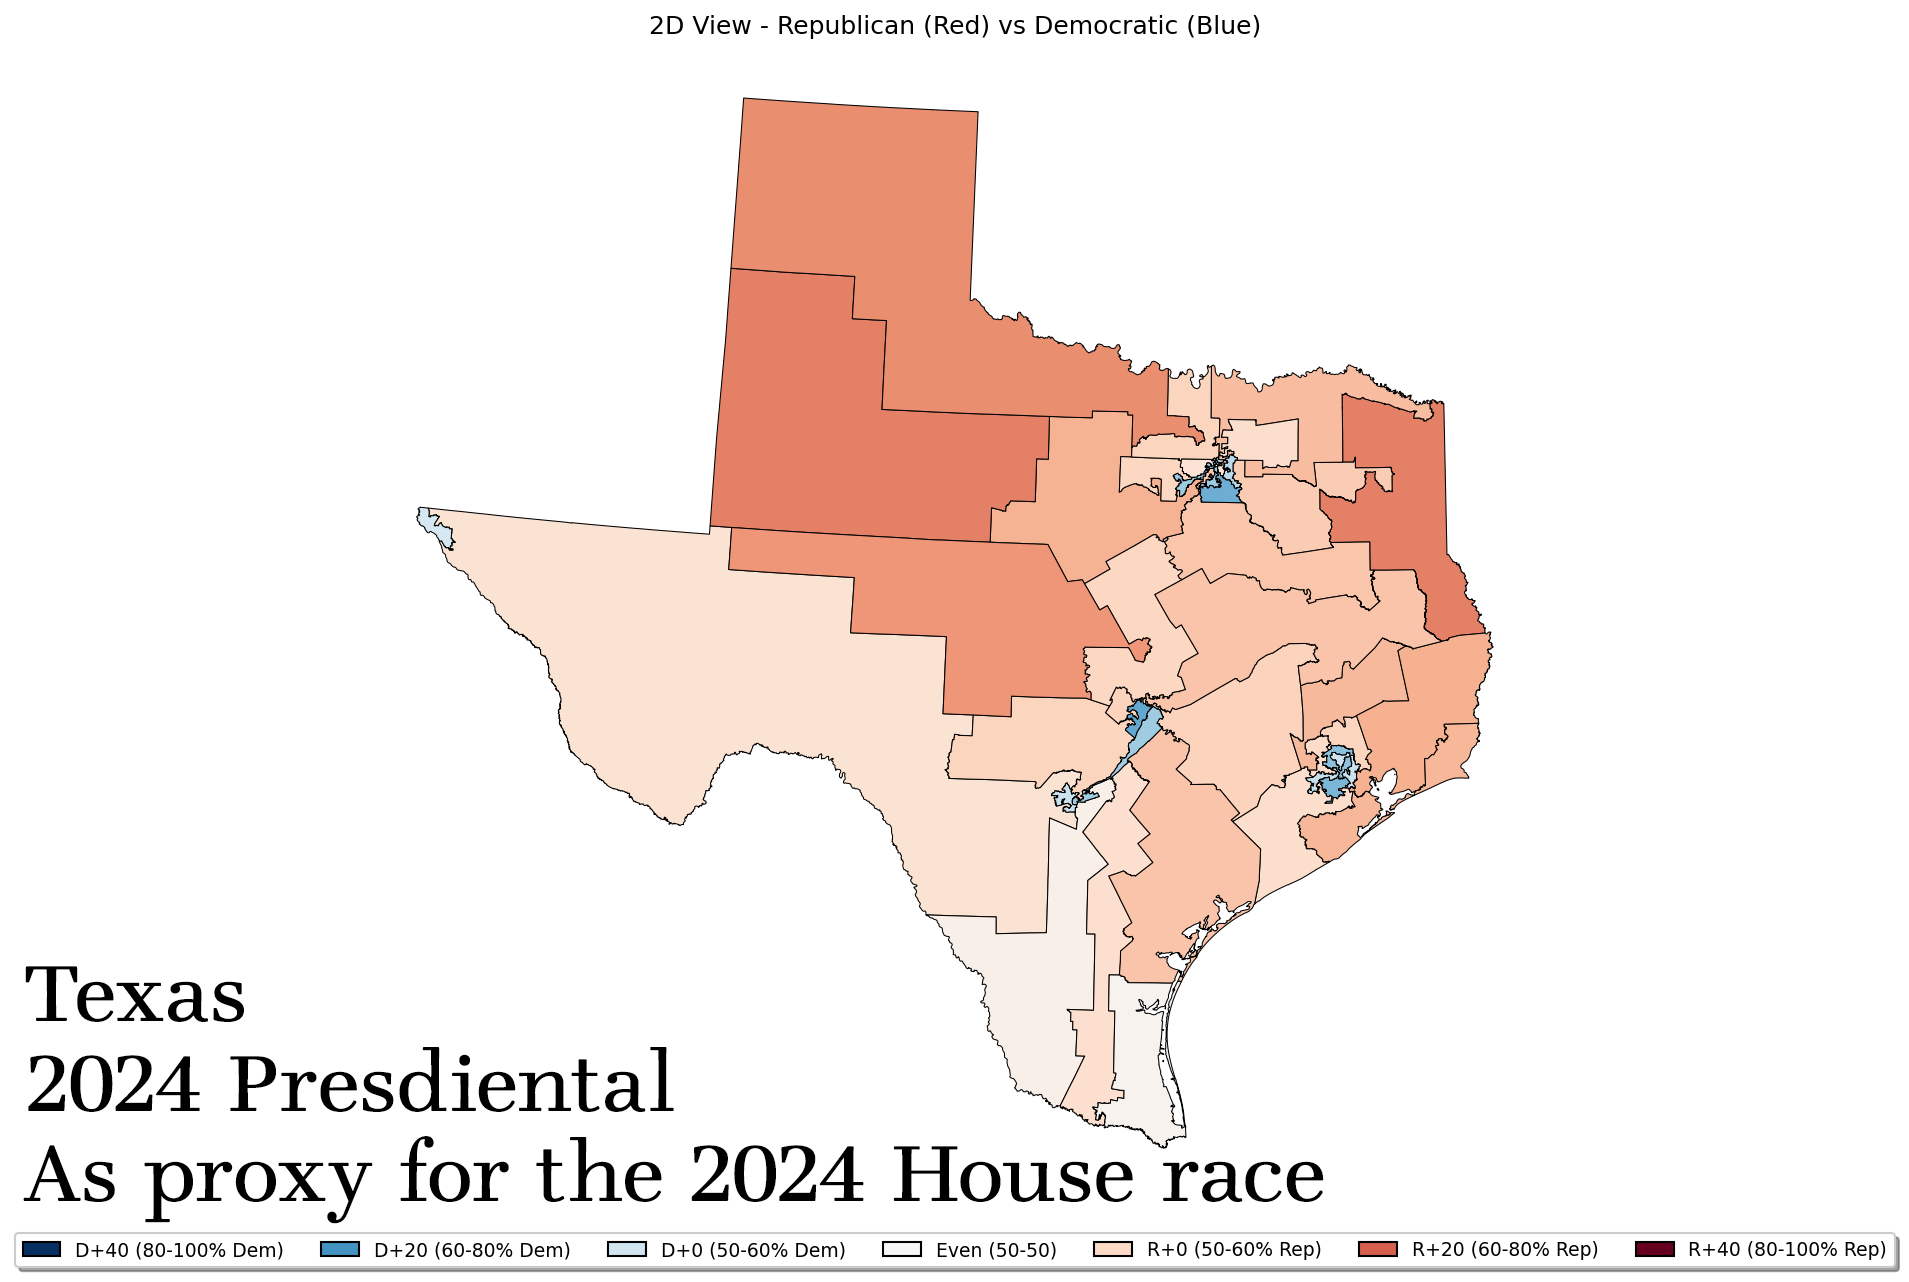
This map just takes precinct level Presidential election data, maps those precincts onto the 2024 House districts, and treats that outcome like the result for each district. Running the numbers this way lets us see what Texas’s efficiency gap would have been if all elections were contested.
If all races are opposed, Texas’ efficiency gap rises from a fairly reasonable 5.27% to an obviously biased 13.2% in favor of Republicans.
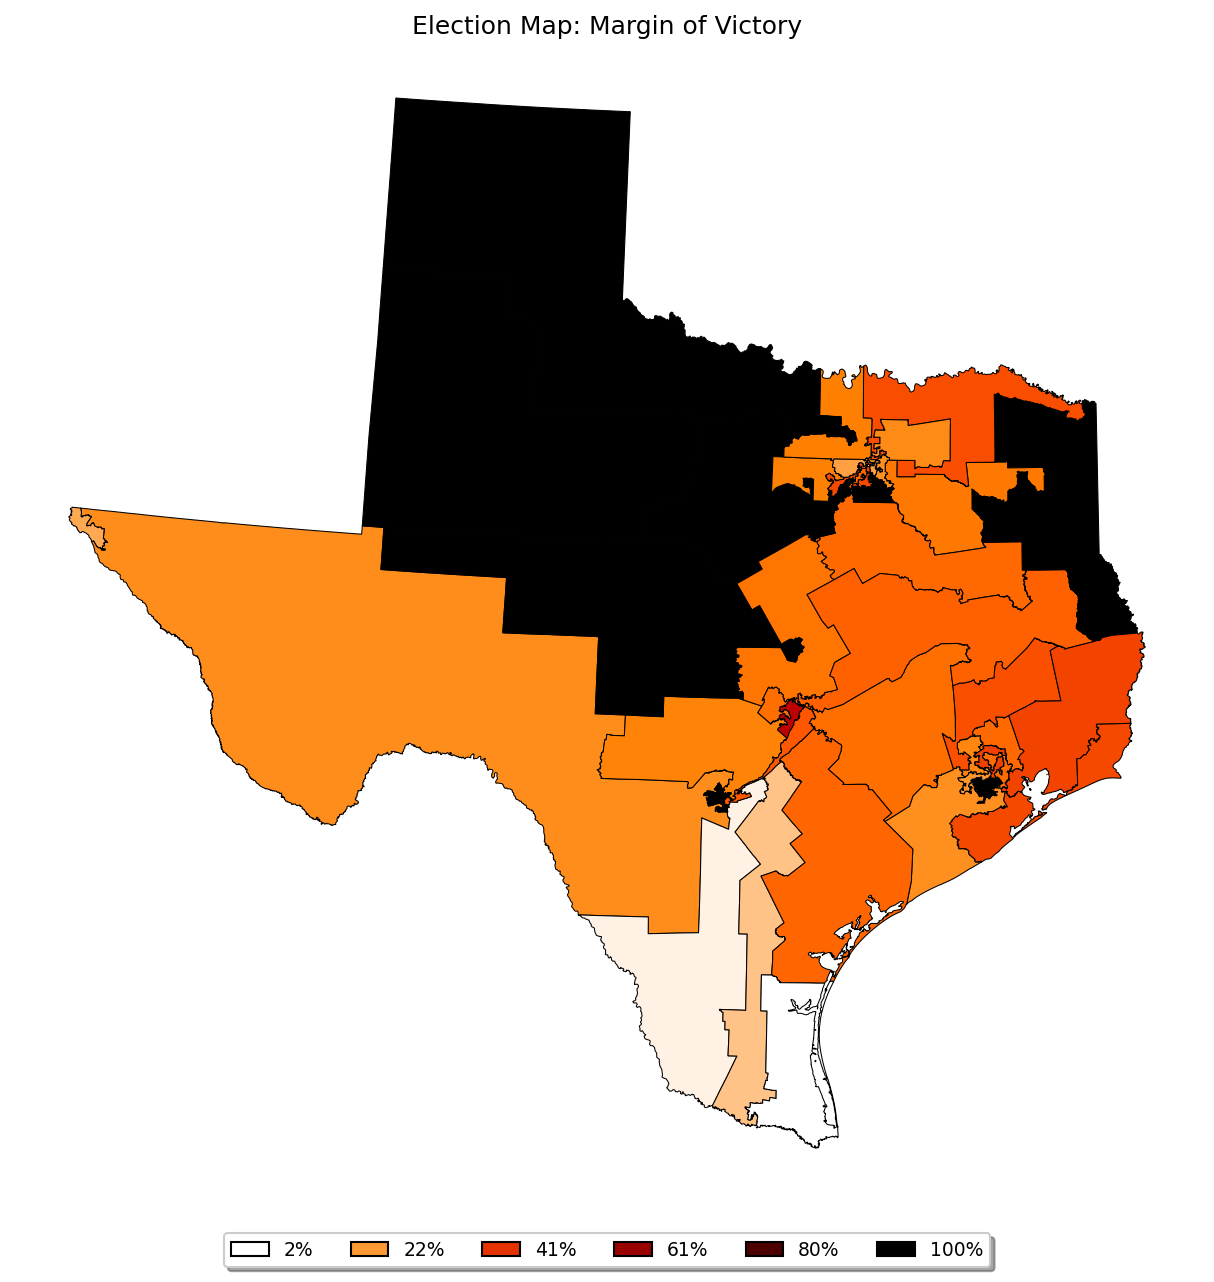
But while the overall bias of the map matters, each district wastes votes individually and contributes to the gap in its own way.
Thinking about the map in terms of efficiency rather than winner-outcome changes things. From an efficiency standpoint, a gerrymandering party is much better off drawing districts that help them win races by a narrow margin. Narrow margins waste the maximum amount of the opposition’s votes and the smallest amount of the gerrymanderer’s.
So that’s the 2024 map. Now let’s compare it to the 2025 map.
Texas in 2025
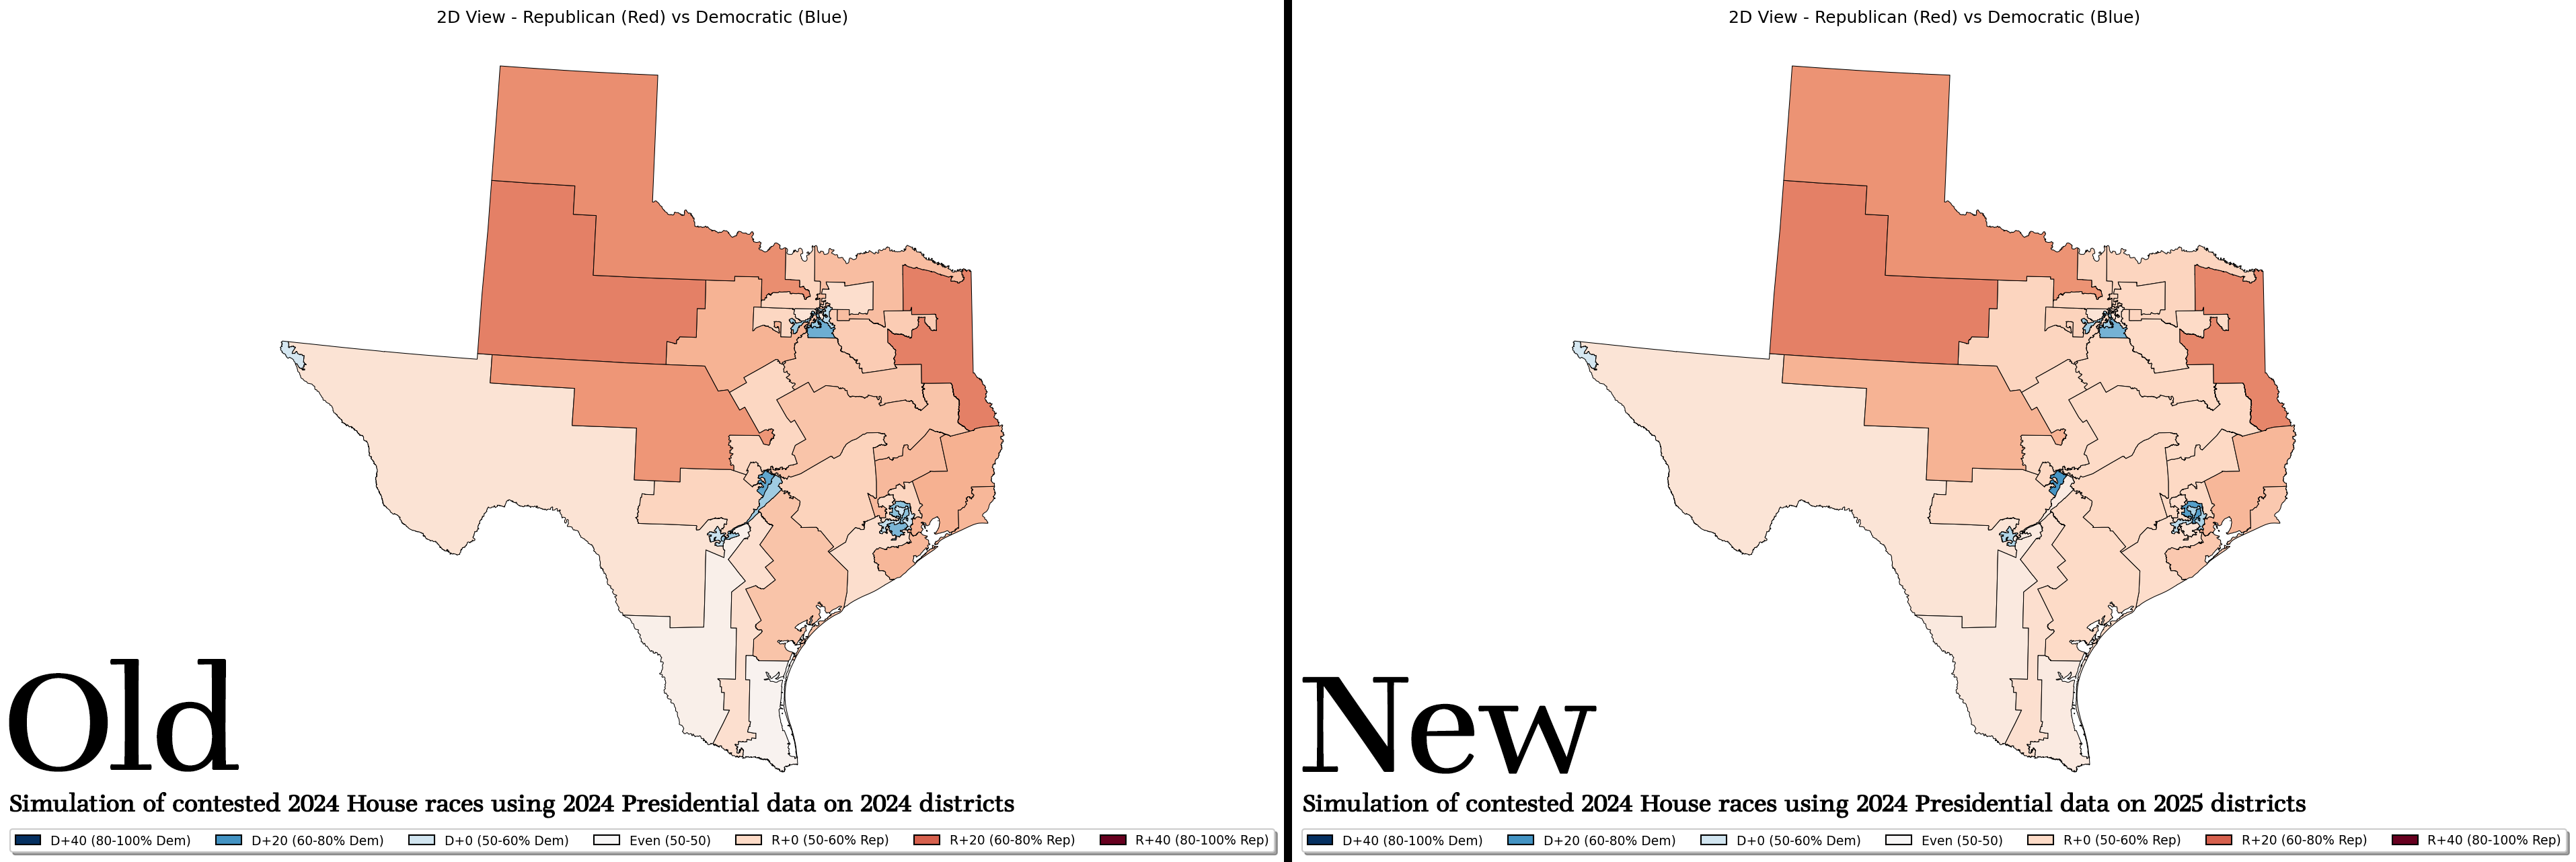
We can map the same precinct-level, 2024 Presidential election data onto the new districts. Mostly. This is not a perfect process because the new districts break several of the existing precincts up. Without knowing where specific votes come from within the precinct it is difficult to know how those votes will be distributed.
For the sake of simplicity, this analysis just divides the votes evenly. If a precinct is split three ways among three districts, each districts gets 1/3 of its Democratic votes and 1/3 of its Republican votes.
The differences here are subtle. Even in a side-by-side view it’s hard to pick them out. But they are there.
The difference is rather more stark when we compare the efficiency gaps. Texas’ new maps are much more efficient at wasting Democratic votes.
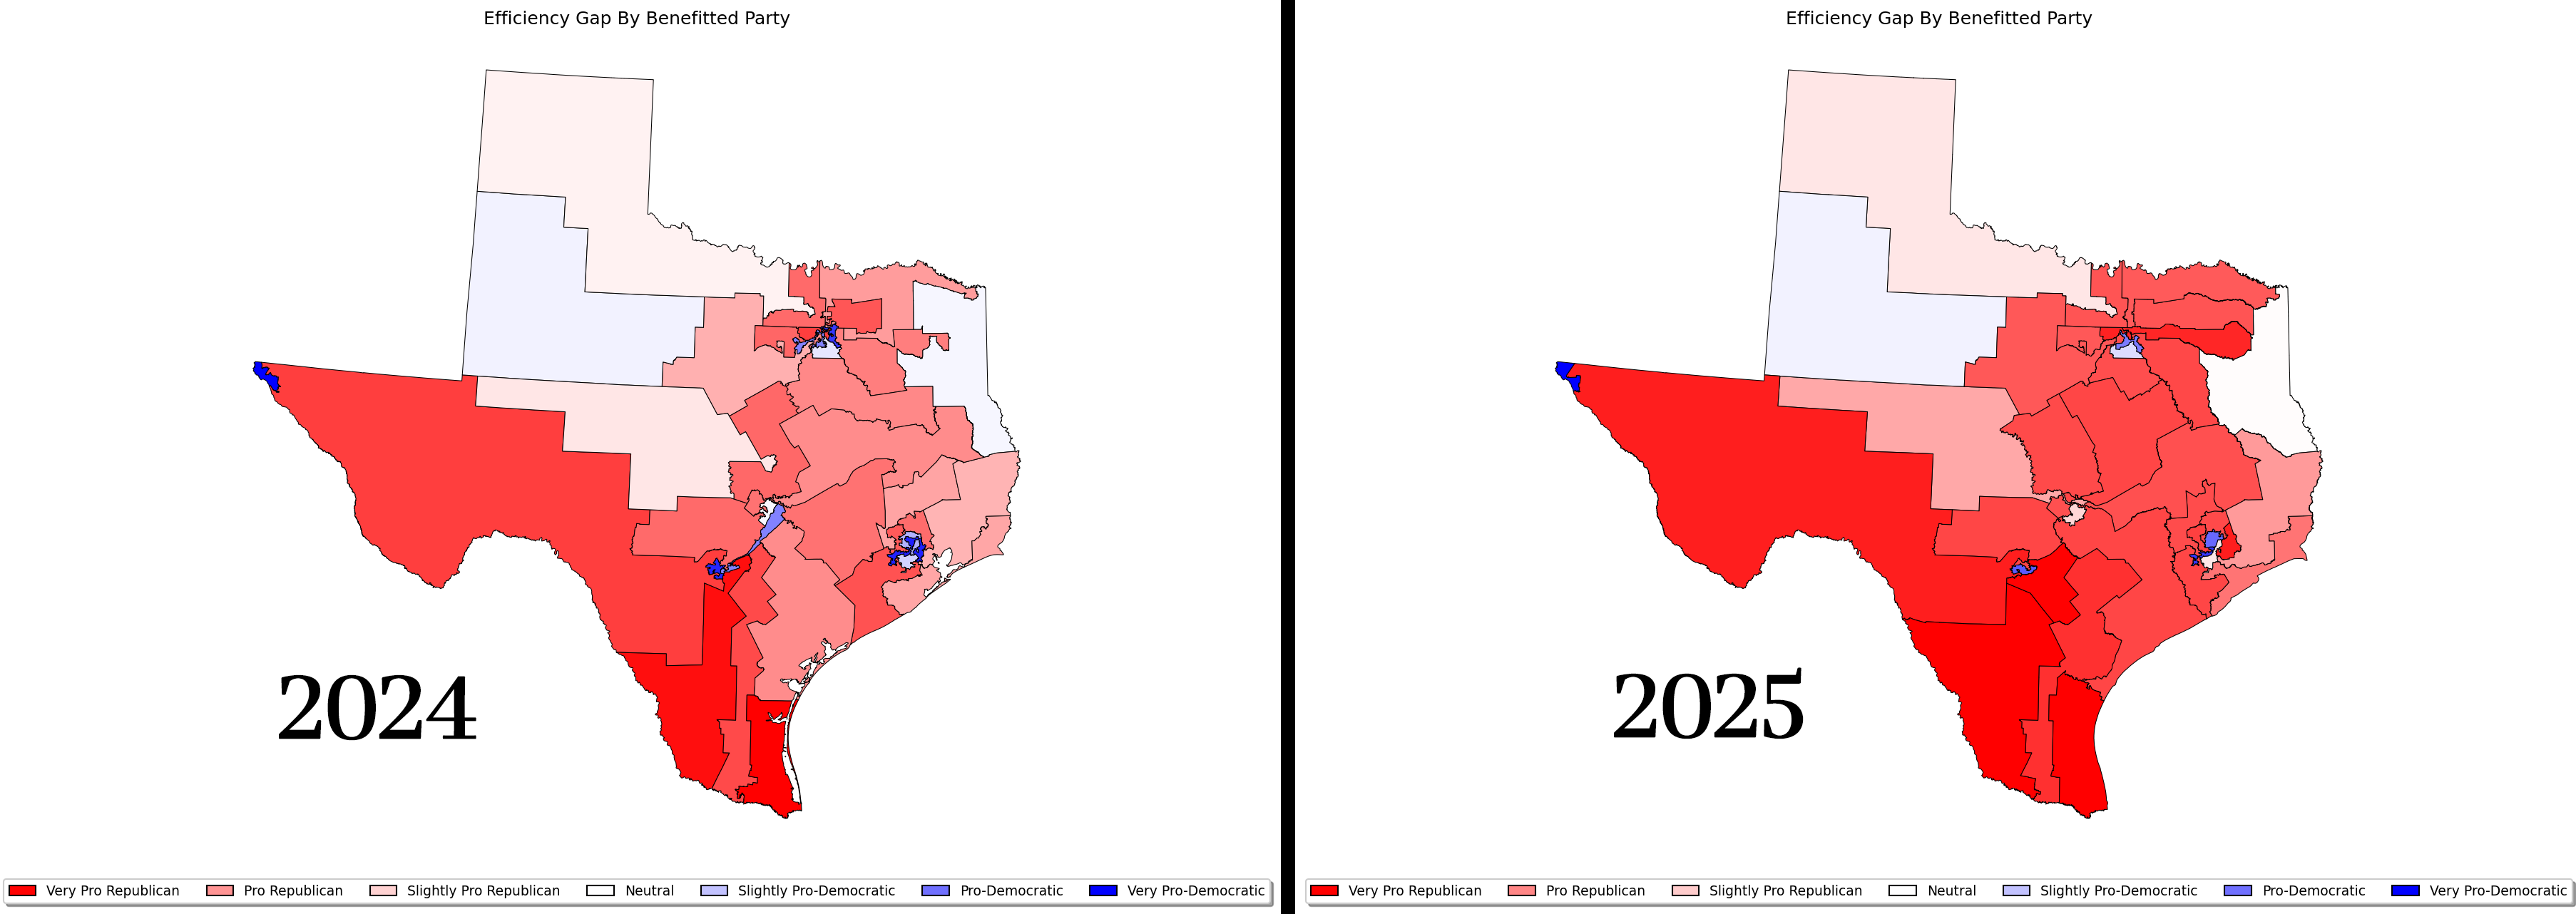
Specifically, the new map is about 6% more efficient in disenfranchising Democrats: its efficiency gap is 19.4%.
Wasted Votes (again)
And again, that gap is manufactured by ensuring that Democratic votes are wasted in greater numbers than Republican votes. That’s true across Texas but it’s also true district by district. The maps below show (left) how our hypothetical congressional election would play out district-by-district on the 2025 map and (right) which and how many votes are wasted in each district.
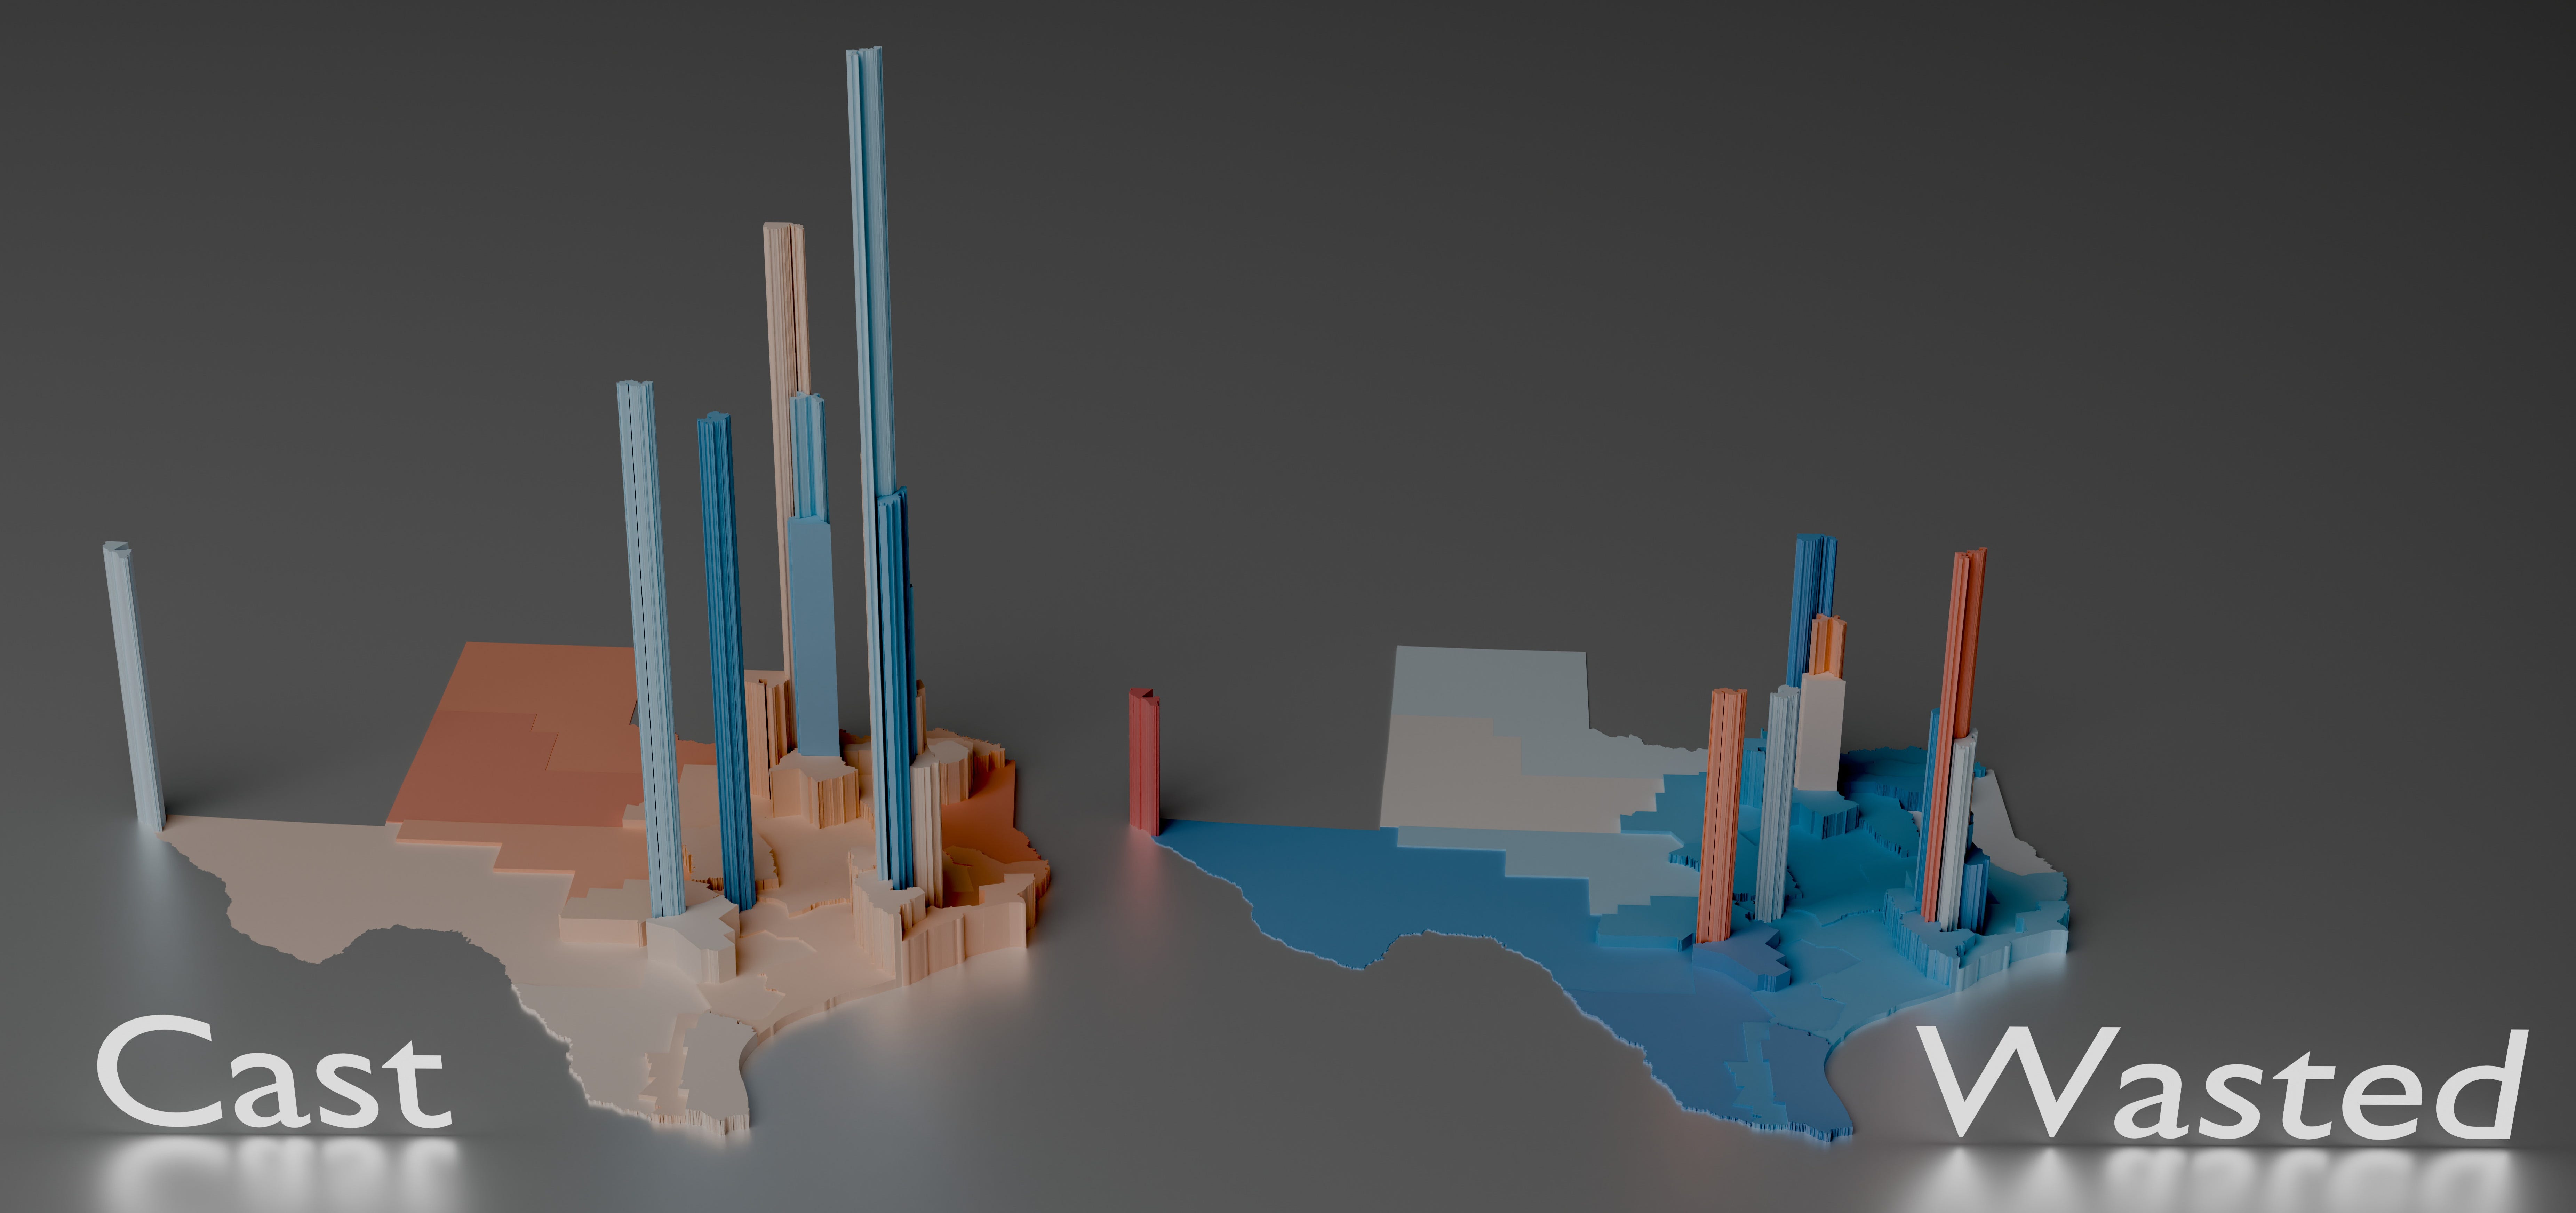
These district-shaped-columns represent the people who are not represented by the folks Texas sends to Congress. As Texas gerrymanders, its Congressional Delegation becomes less representative of the state to the detriment of both Democrats and Republicans. Democrats don’t have Democrats to represent them in Congress and Republicans have Republicans who are fundamentally unaccountable to the voters because their elections are a sure thing.
But look back at those two Texas maps and pay attention to where the most Democratic votes are wasted. It looks like those tall towers, but geometry is deceptive here because they represent small, densely populated districts: tall things look bigger than short and wide things. In truth, the bulk of the waste is in those large, “low-rise” districts surrounding those big towers. Let’s take a closer look at the map of Texas’ wasted votes.
That’s a lot of blue but if you look carefully and compare it to the outcomes map you’ll notice that much of it comes from districts which are very close, especially the rural and suburban districts in East Texas. Close races are great for building an efficiency gap. All of your opponent’s votes are wasted while your thin margin means you had just enough votes to carry the race.
But… “just enough votes to carry the race” is a moving target. Demographic shifts happen. Politics change. Time waits for no man.
Texas in 2026
The boundaries Republicans drew for Texas are based on Trump’s performance in the 2024 election: the same dataset we’re using here. That’s why our simulated election shows Republicans picking up the five seats they set out to snag by drawing these maps.
But… what if the 2026 election doesn’t shake out like 2024? As of this writing, Democrats are outperforming their 2024 races by about 15 points. A 15 point swing is a blue wave by any metric but it does interesting things to a gerrymandered map.
Here’s what Texas would look like under a D+0, D+5, D+10, and D+15 scenario (relative to 2024) under their old maps:
Remember, these maps are already gerrymandered. They’re already drawn to create races with comfortable margins that Democrats shouldn’t win, thereby wasting Democratic votes. But when the a political wave overtops those levies, the spill-over turns “leans Republican” districts into “leans Democratic” districts at higher-than-expected rates. That’s why it takes just a 15 point swing to more than completely invert the Texas House map despite Texas itself being about 60/40 Republican/Democratic.
Gerrymanders tend to amplify political “wave” elections.
And the more severe the gerrymander is, the more it amplifies it. Here’s Texas, again with D+0 through D+15 scenarios, but this time using the new maps.
At D+5 all of the gains from introducing the new maps are wiped out and at D+7 the new maps actually hurt Republicans more than they help. Every scenario with more than a 7-point shift to Democrats over the 2024 election nets Democrats more seats than they’d have won under the old maps.
This is what’s called a “dummymander” and it is a real possibility. The 2024 election represented a 6-point swing to the right as compared to the 2020 election. Between COVID, inflation, and the rise of authoritarian nationalism in the United States we do live in interesting times, but Biden won in 2020 by just about the same margin Obama did in 2012.
So a national six point shift to the left vis-à-vis 2024 is not just possible but could very well be the political baseline to which the United States might return even absent a reaction to Trump.
Texas Republicans should be careful what they wish for; they might just get it.